
Overview
The ability to access the internal state of your application ecosystem is critical to optimizing your applications and the experience of your users. Elastic Cloud on Microsoft Azure gives you access to Elastic observability allowing you to monitor your infrastructure and see how every signal interrelates by utilizing a wide variety of resources that can be deployed in minutes.
By using our Elasticsearch managed service on Azure, you get to take advantage of benefits such as one-click upgrades and much more, simplifying your IT operations. For more details go to Elastic Cloud. We help you bring your logs, metrics, and APM traces together at scale so you can easily assess the current state of your system. You can also use machine learning to detect anomalies and alerting to let you know what is awry, so you can quickly react to events happening in your environment.
The first step towards observability is usually log aggregation/analytics. With that being said, what is Filebeat? Well, Filebeat is a lightweight shipper for forwarding and centralizing log data and files. By installing Filebeat as an agent on your servers, you’re able to collect log events and forward them to either Elasticsearch or Logstash for indexing.
In a previous blog, Getting Started with Elastic Cloud on Microsoft Azure, we showed you how easy it is to get up and running with Elastic Cloud on Azure, taking full advantage of integrated billing. Check it out if you have not already spun up your deployment in anticipation of this blog. Signing up for the Elastic Cloud (Elasticsearch managed service) through the Azure Marketplace takes a short time and offers great flexibility, so try it out today.
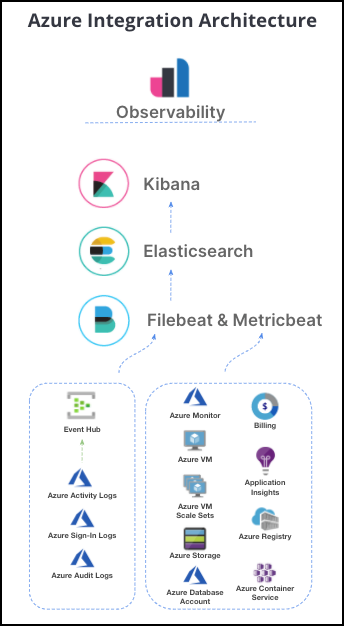
The intent here is to show you how easy it is to get Azure activity logs into Elasticsearch with Filebeat and visualize the aggregated data with Kibana. Kibana provides powerful out-of-the-box visualizations and dashboards to search and analyze your data, reducing the amount of time and effort to get started.
With the Elasticsearch managed service on Azure you can:
- Monitor your activity, sign-in, and audit logs using the Filebeat Azure module with Event Hub
- Analyze your compute, container, database storage, billing, and application insight metrics using the Metricbeat Azure module (covered in a future blog)
Analyze them all under one Elastic Observability solution!
Ingesting logs
Kibana, the visualization and administrative interface for the Elastic Stack, you’ll find instructions for the installation of Filebeat, which we’ll use to ingest the Azure activity, sign-in, and/or audit logs mentioned earlier.
Download and install Filebeat
Starting with deployment version 7.10*, from the Kibana Home page click Install Filebeat.
*If you have not yet upgraded your deployment to 7.10, take the time to visit our Upgrade versions documentation. The upgrades are designed to be automated while helping mitigate unplanned downtime.
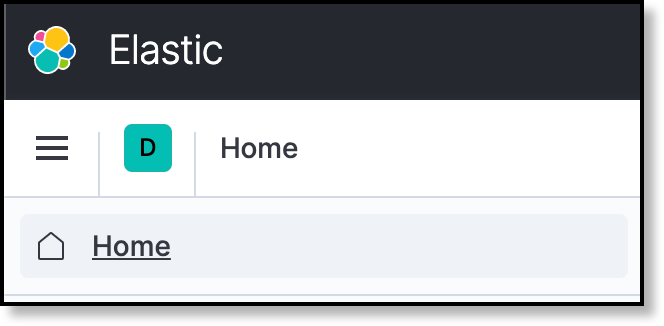
To begin with, click the navigation menu and then Home.
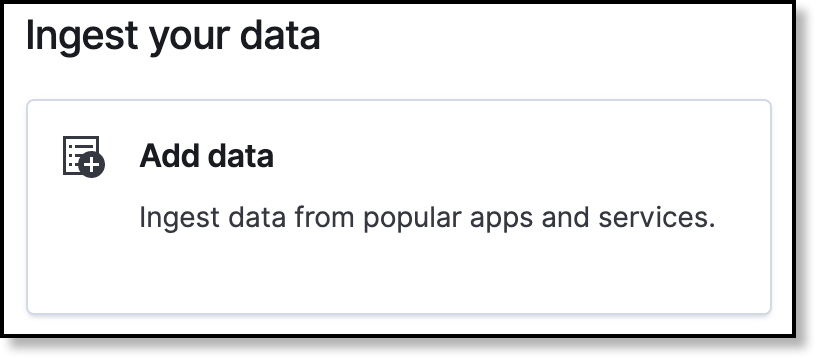
Click Add data.
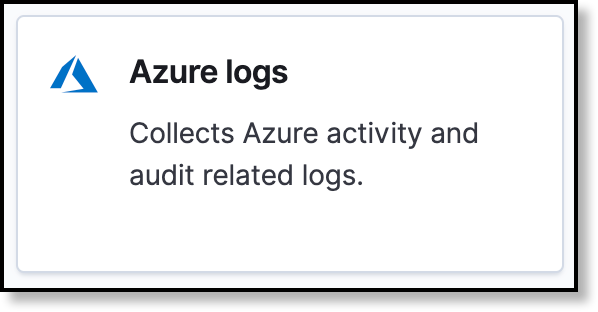
This has taken us to the Add data menu, where we will choose Azure logs.
Follow the steps to install Filebeat on your system. You can click the View exported fields and Learn more links to reference additional Filebeat information.
You can leave this page open for when you’ve completed the following configurations, as we will come back to it.
Configure Filebeat
Once Filebeat for your particular system has been downloaded and installed, you will need to modify the filebeat.yml file.
On a Linux system, this is typically found under /etc/filebeat.
The great thing about running through this process from Kibana, is that it will show you how to add the necessary entries to that file in order to communicate with your Elastic Cloud deployment – two variables cloud.id and cloud.auth that you must modify.
For those who have Elastic Stack running self-managed in their own Azure account, please refer to the Connect to Elastic Stack Filebeat Quick start guide.
Tip: Not sure where to get these values? Refer to our documentation for more details.
Create an Event Hub
This solution requires the use of Azure Event Hub for the activity, sign-in, and/or audit logs, as well as access to a storage blob. If you do not have such an event hub set up, please refer to the Create an Azure event hub quick start documentation for details. You will then need to refer to the instructions on sending activity logs to the event hub.
When creating an event hub, you can add it to an existing namespace if you already have one, or you can create an entirely new one, as we will demonstrate here.
From your Azure portal Event Hubs, click Add.
You must select a resource group, and then name it: for example, elastic-eventhub.
Choose the location and pricing tier and then proceed, adding optional tags if desired, then click Create.
Click Shared access policies.
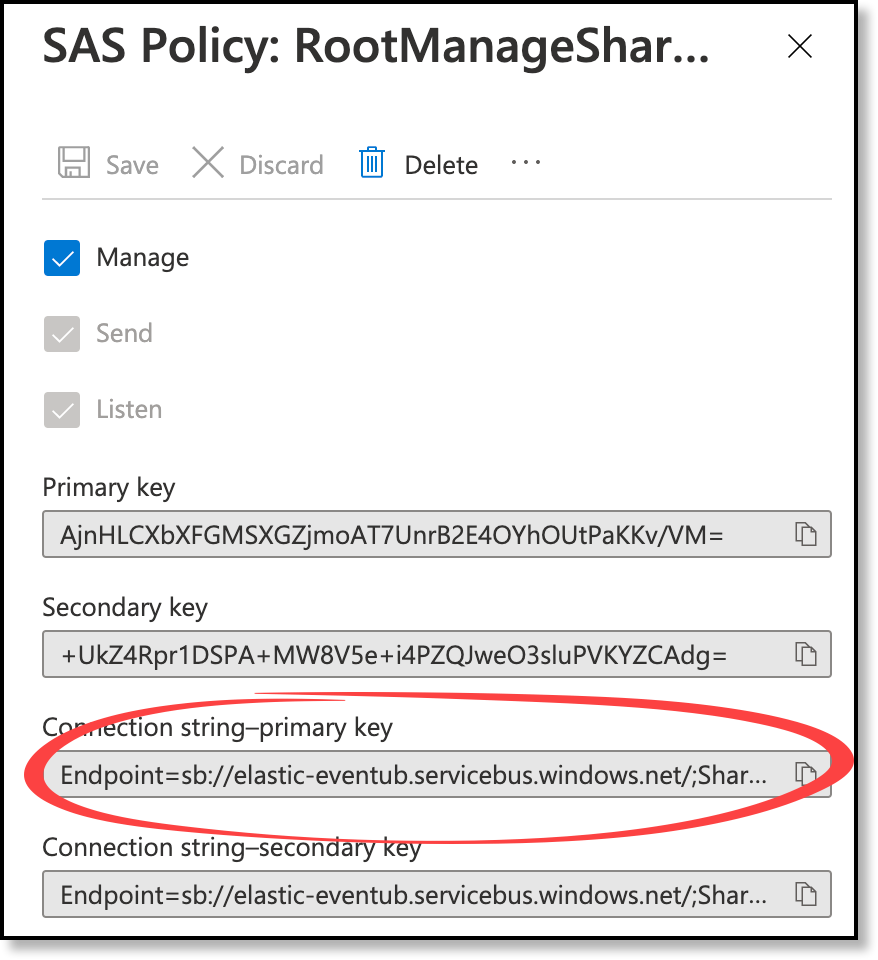
Click the default policy that appears, named RootManageSharedAccessKey and then click to copy the connection string. Paste that somewhere safe, as it will be used to configure the Filebeat Azure module configuration file, azure.yml.
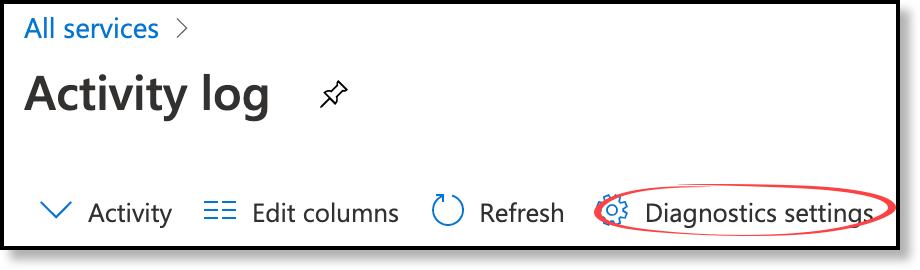
Navigate to Activity Logs and then click Diagnostics settings.
Click Add diagnostic setting and name it elastic-diag.
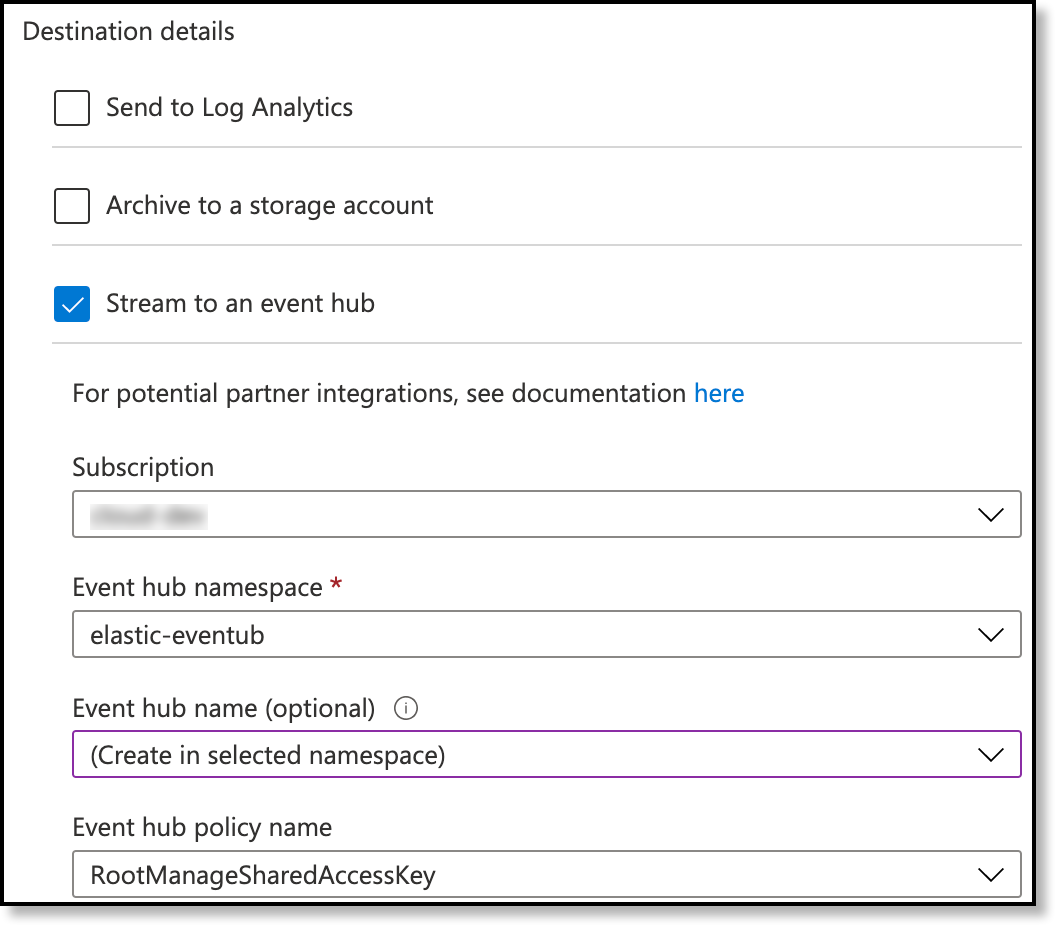
Select the logs of your choice, and then be sure to also select Stream to an event hub.
Choose the elastic-eventhub namespace, select the (Create in selected namespace) option for the event hub name, then select the RootManageShareAccessKey policy.
An event hub named insights-activity-logs will be created for you, appearing under the elastic-eventhub namespace, for which we will use in the azure.yml configuration file.
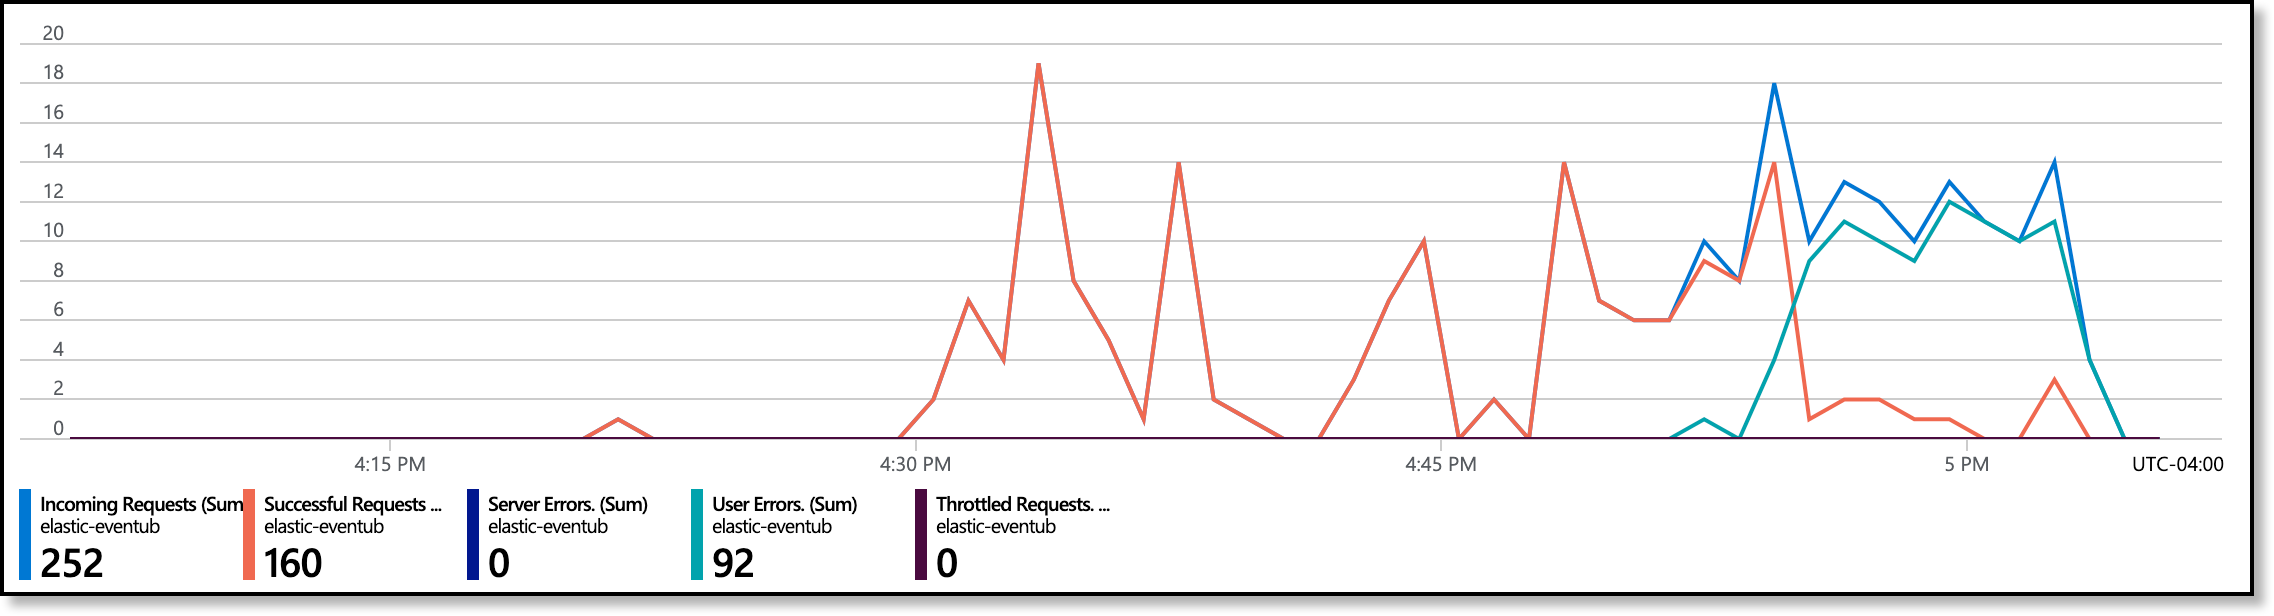
Click Save, then optionally navigate back to elastic-eventhub and to see the event metrics coming in.
Enable and configure the Azure module
Simply run one command which enables the Azure module. This is depicted from the page within Kibana, where we started, as step three.
This will ensure that the azure.yml configuration file becomes active, in order to communicate with your Azure subscription.
The command to enabled the module on Linux is:
sudo filebeat modules enable azure
To list all modules, displaying the enabled ones at the top, run:
sudo filebeat modules list
To disable the module, simply run:
sudo filebeat modules disable azure
You have to configure the azure.yml file after enabling it. On Linux this is typically found under the /etc/filebeat/modules.d directory. If a module is not enabled, there will be a .disabled extension in that directory as well.
Only the activitylogs is enabled by default within the Azure module, expressed by enabled: true.
In order to configure the auditlogs and signinlogs, you must be a global administrator or security administrator of your Azure account. You can refer to the instruction on how to export audit and sign-in logs to the event hub for more details. You can then enable them by changing the enabled: false to true.
Important: If you do not have sufficient permissions to configure the audit and sign-in logs, then those modules in the azure.yml file must remain disabled.
Time to add the information to azure.yml configuration file. All you need to add is the eventhub and connection_string entry details saved earlier, and then the storage account details.
Pro Tip: The storage account name and key needed can be found from the Storage account you want to utilize. Click Access keys. You can also refer to the Microsoft Azure Manage storage account access keys for help.
Your configuration file, assuming you are only configuring the activity logs, would be similar to the following.
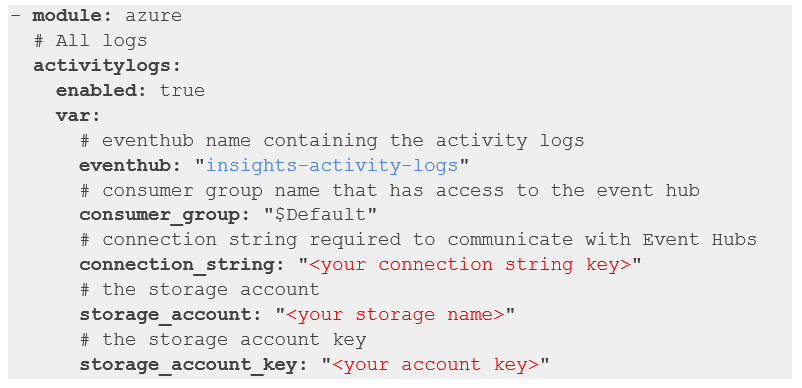
For more information on this configuration, please refer to the module configuration documentation. The storage account/key is necessary in order to maintain the sequence of logs should the Filebeat service stop.
Pro tip: The eventhub is the instance name, rather than the Event Hub Namespace. Event Hub namespaces are the grouping container for multiple event hubs, and you are billed at the namespace level. Refer to the Event Hubs FAQ on Microsoft’s docs site for more details on this.
Setting up and starting Filebeat
Now that Filebeat, an event hub, and storage account have been configured it is time to kick things off by running setup and starting Filebeat.
Back on the Kibana page where we started downloading and configuring Filebeat, step four outlines the following commands which are needed at this point.
Because we used RPM to install Filebeat as a service, it must also be used to run it as a service. Depending on the type of system you are using, it could be slightly different. Please refer to the Filebeat and systemd for more details on running Filebeat as a service for DEB and RPM packages, or refer to the Filebeat quick start if running on a different platform.
First we need to run the setup step, which will load such things as predefined assets, indexes, and visualizations which are used by the predefined Azure Cloud dashboards. The setup command takes advantage of all the out-of-the-box integrations Elastic has with Azure, alleviating the need to develop your own, however, everything is fully customizable and there are many community developed integrations.
Run the setup:
sudo filebeat setup
You can also run the setup command with a -e for which will send logging data to the display, rather than to the syslog, useful to see what steps are being taken.
sudo filebeat setup -e
Then, start the service:
sudo service filebeat start
To check the status:
sudo service filebeat status
To stop Filebeat:
sudo service filebeat stop
To check and validate, with a running dialog, the service is running healthy:
sudo journalctl -u filebeat -f
Visualizing in Kibana
Now that we have the activity logs being collected by the event hub, and, in turn, being sent to Elasticsearch by Filebeat, we can visualize them in Kibana.
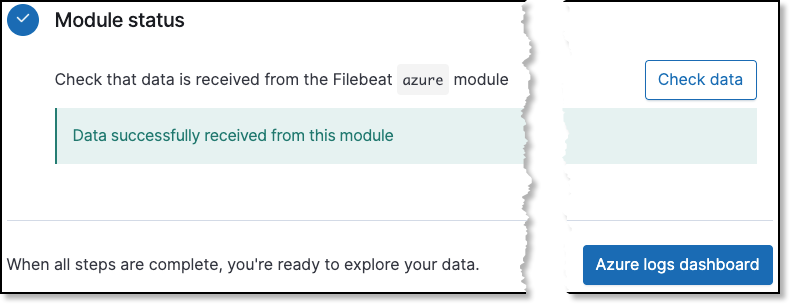
Assuming you still have the page open where we initiated the Filebeat configuration, you should be able to Check data and then finally click Azure logs dashboard, which will take you right to the dashboard
Conclusion
We hope you found this to be a helpful resource for getting started with Filebeat, ingesting Azure activity logs with the use of an event hub.
The next step is to collect your Azure compute, container, database storage, billing, and application insight metrics using the Metricbeat Azure module.
Have questions or want to contribute to a beneficial discussion? Be sure to check out the Elastic Observability discussion group. There are also a number of getting started videos and training resources you can take advantage of by visiting elastic.co/learn.