A common problem that I've run across throughout my career is supporting applications which have gone to production. When supporting a service in production, it is important to be able to identify where things went wrong and how to fix them before customers/end users are impacted.
Application logs are usually first place that I usually check when I'm notified of a production issue. Seems simple enough right? Open a file look for the words "exception" or "error" and backtrack from there. The only problem is that this approach to troubleshooting becomes unsustainable in today's environments where services can be comprised of decentralized, distributed, constituent applications.
How would you go about monitoring multiple services (i.e. micro-service architecture) without the increased cognitive load that comes with complicating the troubleshooting process?
Monitoring and Kubernetes
Although there are multiple ways of performing monitoring which can be dependent on which platform you're using and what tools are available for your platform (i.e. GCP, Azure, AWS), I'm going to be focusing on how to perform monitoring on a Kubernetes cluster.
Fortunately when working in the context of a Kubernetes cluster, there's a fair bit of open source projects which can aid in providing observability and monitoring for services.
For the ease of use, I'll be using Linkerd. Linkerd is a service mesh and is fairly easy to set up. Additionally, with Linkerd, you get Prometheus and Grafana included for FREE!
What is a Service Mesh?
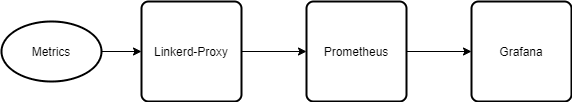
In the context of a Kubernetes cluster, a service mesh is a collection of applications, services, and custom resources which provide observability, scalability, and resiliency for applications in your cluster. Linkerd specifically uses a pod-sidecar called Linkerd Proxy which proxies API calls to your services and provides metrics back to Linkerd. These metrics are reported to Prometheus which is a tool for viewing metrics and managing alerts. Prometheus reports metrics to Grafana which provides visualizations of these metrics in the form of charts and graphs which makes the metrics easier to digest.
Additionally, Grafana has a plugin, Loki which is designed to feed logs to Grafana allowing you to search through logs with relative ease.
The flow for application metrics will resemble the following:
Additionally, an application log flow will look like the following:

Setting up Linkerd
Assuming you have your Kubernetes cluster all set up, setting up Linkerd will be relatively straightforward. Linkerd provides a command-line interface (CLI) tool which makes managing Linkerd pretty easy.
Install the CLI following these instructions:
curl -sL https://run.linkerd.io/install | sh
# Add Linkerd to path
export PATH=$PATH:$HOME/.linkerd2/bin
# Deploy Linkerd to your cluster
linkerd install | kubectl apply -f -
From here, you'll be able to access Grafana from the Linkerd Dashboard
# Open a browser window to the linkerd dashboard
linkerd dashboard
Kubernetes resources can be assigned to Linkerd using annotations to either a Deployment or Namespace:
apiVersion: v1
kind: Namespace
metadata:
  linkerd.io/inject: enabled
apiVersion: apps/v1
kind: Deployment
metadata:
  linkerd.io/inject: enabled
Logging Operator
Logging Operator is a project created by Banzai Cloud which is powered by FluentD and FluentBit in order to perform log discovery.
We begin by deploying the logging operator onto our Kubernetes cluster. Fortunately, there's a helm chart which makes the deployment easier.
# Create a logging namespace
apiVersion: v1
kind: Namespace
metadata:
  name: logging
# Add the helm repo
helm repo add banzaicloud-stable https://kubernetes-charts.banzaicloud.com
# Install the helm chart
helm upgrade --install --wait --create-namespace --namespace logging logging-operator banzaicloud-stable/logging-operator \
  --set createCustomResource=false"
Deploying Loki
Now that Logging Operator is present to set up log discovery across our various sources, it's time to set up Loki and Grafana.
Grafana community has set up a helm chart which will help in building a Loki stack using terraform:
resource "helm_release" "rel_logging_loki" {
  repository = "https://grafana.github.io/helm-charts"
  chart = "loki-stack"
  name = "loki"
  namespace = "logging"

  set {
    name = "pomtail.enabled"
    value = "true"
  }
  set {
    name = "loki.enabled"
    value = "true"
  }
}
Linkerd will need to be updated so that Grafana talks to Loki.
To preform the set up, we'll use a built-in Kubernetes utility kustomize in order to patch the new Grafana configuration into Linkerd's Grafana instance.
grafana.yml
kind: ConfigMap
apiVersion: v1
metadata:
  name: linkerd-grafana-config
data:
  datasources.yaml: |-
    apiVersion: 1
    datasources:
    - name: prometheus
      type: prometheus
      access: proxy
      orgId: 1
      url: http://linkerd-prometheus.linkerd.svc.cluster.local:9090
      isDefault: false
      jsonData:
        timeInterval: "5s"
      version: 1
      editable: true
    - name: Loki
      type: loki
      access: proxy
      editable: false
      default: true
      url: http://loki.logging:3100
      maximumLines: "300"
Set up a kustomization.yml:
resources:
- linkerd.yml
patchesStrategicMerge:
- grafana.yml
Now we can dump our current Linkerd config and run kubectl kustomize to patch the Grafana configuration from the previous step into Linkerd
linkerd upgrade > linkerd.yml
kubectl kustomize | kubectl apply -f -
Setting up Logging Operator to Stream to Loki
The last step we'll have to complete is setting up the logging operator to stream to Loki.
The Logging operator specifies the following custom resources which are used to watch containers and transport logs to a target destination:
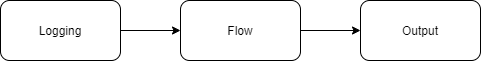
- Logging - Specifies a logging source
- Output - Specifies a destination for log outputs. These resources can also be established cluster-wide as a ClusterOutput
- Flow - Connects Logging resources to Output resources and specifies patterns which are used to parse log entries. These resources can also be established cluster-wide as a ClusterFlow.
Specify a ClusterFlow to send logs to Loki:
apiVersion: logging.banzaicloud.io/v1beta1
kind: ClusterOutput
metadata:
  name: loki-output
  namespace: logging
spec:
  loki:
    url: http://loki:3100
    configure_kubernetes_labels: true
    buffer:
      timekey: 1m
      timekey_wait: 30s
      timekey_use_utc: true
For each Pod/Deployment you want to monitor, you're going to need to set up a Logging and a Flow:
# Set up the Logging object
apiVersion: logging.banzaicloud.io/v1beta1
kind: Logging
metadata:
  name: files-logger
  namespace: files
spec:
  fluentd: {}
  fluentbit: {}
  controlNamespace: logging
---
# Set up the Flow object
apiVersion: logging.banzaicloud.io/v1beta1
kind: Flow
metadata:
  name: files-flow
  namespace: files
spec:
  globalOutputRefs:
  - logging-index-output
  filters:
    - tag_normaliser: {}
    - parser:
        remove_key_name_field: true
        reserve_data: true
        parse:
          type: multi_format
          patterns:
            - format: regexp
              expression: '/^(?<time>[^\]]*) \[(?<level>[^ ]*)\] (?<source>[^\":]*): (?<message>.*)$/'
              time_key: logtime
              time_format: '%Y-%m-%dT%H:%M:%S.%LZ'
            - format: regexp
              expression: '/^time="(?<time>[^\]]*)" level=(?<level>[^ ]*) msg="(?<message>[^\"]*)"/'
              time_key: time
              time_format: '%Y-%m-%dT%H:%M:%SZ'
            - format: regexp
              expression: '/^level=(?<level>[^ ]*) ts=(?<time>[^\]]*) caller=(?<source>.*) msg="(?<message>[^\"]*)"/'
              time_key: time
              time_format: '%Y-%m-%dT%H:%M:%S.%LZ'
            - format: regexp
              expression: '^(?<host>[^ ]*) [^ ]* (?<user>[^ ]*) \[(?<time>[^\]]*)\] "(?<method>\S+)(?: +(?<path>[^ ]*) +\S*)?" (?<code>[^ ]*) (?<size>[^ ]*)(?: "(?<referer>[^\"]*)" "(?<agent>[^\"]*)")?$'
              time_key: time
              time_format: '%d/%b/%Y:%H:%M:%S %z'
  match:
  - select:
      labels:
        app: owncloud
ℹ The Flow object in this example uses FluentD expressions to parse log streams. The FluentD expressions can be evaluated/debugged using Fluentar
The globalOutputRefs section matches the Flow resource with an Output. The Output will route the logs to the indicated destination.
The match section indicates what Kubernetes resources the Flow resource will look for in order to obtain logs. In this example, the Flow resource will look for any pods with the label app: owncloud.
If everything is set up right, the logs will be able to be searched in Grafana:

What's Left?
So far I've covered how to set up Linkerd and stream logs to Grafana. An improvement to this set up would be deploying Prometheus AlertManager in order to create and manage alerts so that you can receive notifications through 3rd party services like Slack and PagerDuty.
References
- Customizing Linkerd's Configuration - https://linkerd.io/2/tasks/customize-install/
- Logging Operator Quickstart Guide - Loki- https://banzaicloud.com/docs/one-eye/logging-operator/quickstarts/loki-nginx/
- https://itnext.io/part-4-operations-and-the-cloud-native-stack-in-action-bb17d9f0ff5
Outtakes
This article was roughly 3 months of experimenting in my home-lab. Instead of Graphana and Loki, I had originally attempted to preform log streaming using the Elastic Stack, EFK (Elasticsearch, FluentD, and Kibana).
I'm using Keycloak as an identity provider and had attempted an initial configuration using Kibana and Open-ID Connect (OIDC) based authentication; however, the OIDC plugin is only available on the Platinum Tier of Elastic. Disabling the xpack.security.enabled setting broke the Elastic applications.
Attempting to utilize a keycloak-kibana plugin also caused Kibana to fail to start.
With Loki and Grafana, I'm able to set up a Kubernetes Ingress with OAUTH2 authentication as a way to secure access to my services.


Top comments (2)
Pomtail -> Promtail in

:)
Still learning how this works. I'll issue a correction soon: